
You’re spending £1,500 a month on marketing. Maybe more. Your agency sends a report full of impressions, reach and engagement rates. The graphs go up. But on a Tuesday night the dining room is still half empty, and the booking sheet for the weekend looks the same as it did six months ago.
The problem usually isn’t the budget. It’s that nobody told you which numbers connect to covers, bookings and takings, and which ones just look good in a report. Restaurant marketing KPIs shouldn’t need a data science degree. They should answer one question: is this spend filling tables?
This guide covers the marketing KPIs a restaurant, café or takeaway should track, the ones you can safely ignore, and a worked example showing how to calculate whether your marketing is profitable. In pounds, not percentages.
What Are Restaurant Marketing KPIs (And Why Most Restaurants Track the Wrong Ones)
Marketing KPIs (key performance indicators) are the specific numbers that tell you whether your marketing is achieving your business goals. Not your marketing goals. Your business goals: bookings, covers, orders and revenue. The distinction matters because most restaurants end up drowning in numbers that have nothing to do with whether the phone is ringing or the tables are full.

It’s a common story in hospitality. A restaurant pays for social media management, and every month the report shows more followers, more reach and more likes on food photos. Nobody asks how many of those people actually booked a table. The numbers in the report are real. They just aren’t connected to anything that pays the rent.
KPIs vs Metrics: What’s the Difference?
A metric is any number you can measure: page views, profile views, followers, impressions. A KPI is a metric you’ve chosen because it directly shows progress towards a business goal. Every KPI is a metric, but most metrics aren’t KPIs.
Think of it this way: your menu page getting 3,000 views a month is a metric. How many of those visitors pressed “Book a table” or tapped to call? That’s a KPI. One tells you people are looking. The other tells you whether they’re coming in to eat.
What Are Vanity Metrics for Restaurants?
Vanity metrics look impressive but don’t reliably connect to revenue. The most common ones in restaurant marketing:
- Instagram and TikTok followers. 20,000 followers spread across the country are worth less than 800 who live within a 15-minute drive of your restaurant and actually eat out.
- Likes and views on food content. A viral Reel is exciting, but if the views come from outside your area, the booking sheet won’t change.
- Website visits without context. 5,000 visits last month sounds good. How many booked, called or ordered? If you don’t know, the 5,000 is decoration.
- Impressions. How many times your post or ad was shown. Not how many people cared, and not how many came in.
These numbers aren’t useless. They’re diagnostic. If followers are growing but bookings aren’t, you’re attracting the wrong audience or not giving them a reason to book. The metric helps you diagnose. The KPI tells you whether to worry.
The Restaurant Marketing KPIs That Actually Matter
These are the numbers a restaurant owner should look at every month. Not all of them apply to every business, and a takeaway will weight them differently from a fine-dining restaurant. But if you’re spending money on marketing, at least three of these should be on your radar.

Cost per Booking (Your Customer Acquisition Cost)
Cost per booking tells you how much you spend to win one new table, call or order. It’s the restaurant version of customer acquisition cost (CAC):
Total marketing spend ÷ Number of new bookings (or orders) = Cost per booking
For example, if you spent £1,200 on marketing last month and can trace 80 new bookings to it, your cost per booking is £15. Whether that’s good depends on what a booking is worth. If the average table is 2.5 covers at £28 a head, each booking brings in around £70 at the till, so £15 to win it is comfortable. The same £15 against a £12 takeaway order is a problem, unless that customer orders again and again.
Don’t compare yourself to a national average. The number that matters is whether your cost per booking is well below what each booking brings in.
Customer Lifetime Value (Repeat Visits)
Restaurants live on regulars. Customer lifetime value (CLV) is the total a guest spends with you over the whole time they keep coming back:
Average spend per visit × Visits per year × Years they stay loyal = CLV
A coffee shop regular who visits twice a week and spends £4.50 is worth about £468 a year. A family that eats with you once a month and spends £70 is worth £840 a year, and £2,520 if they stay for three years. That’s why a £15 cost per booking can be a bargain even when the first visit barely covers it.
CLV matters most next to cost per booking. Many businesses aim for a lifetime value at least three times what it cost to win the customer. If you’re spending £20 to win a guest worth £600 over their lifetime, that’s sustainable. If most guests visit once and never return, the problem isn’t marketing. It’s the experience, and more ads won’t fix it.
Booking and Call Conversion Rate
Your conversion rate is the percentage of people who take the action you want. For a restaurant, that means booking a table online, tapping to call, placing an order, or asking for directions.
Number of bookings, calls and orders ÷ Total visitors × 100 = Conversion rate
Conversion rate connects your traffic to your takings. You can have thousands of visitors, but if your booking button is hidden, your menu is a PDF that won’t load on a phone, or your opening hours are wrong, they leave and eat somewhere else.
What Is a Good Conversion Rate for a Restaurant Website?
Published benchmarks vary so much between sources, cuisines and booking systems that they’re rarely useful for an individual restaurant. A better approach is to measure your own baseline for three months, then work to improve it.
Count every action that leads to a visit: online bookings, taps on your phone number, order-button clicks and direction requests. If only a small share of visitors to your menu or home page take any of those actions, look at the page before you spend another pound on traffic. Doubling your conversion rate gives you twice the bookings from the same visitors. That is usually cheaper than doubling your traffic. A well-built restaurant website makes the next step obvious on every page.
Restaurant Marketing KPIs to Track by Channel

Different channels need different KPIs. Here’s what to watch on each channel a restaurant is likely to use, starting with the one that usually matters most.
Google Business Profile
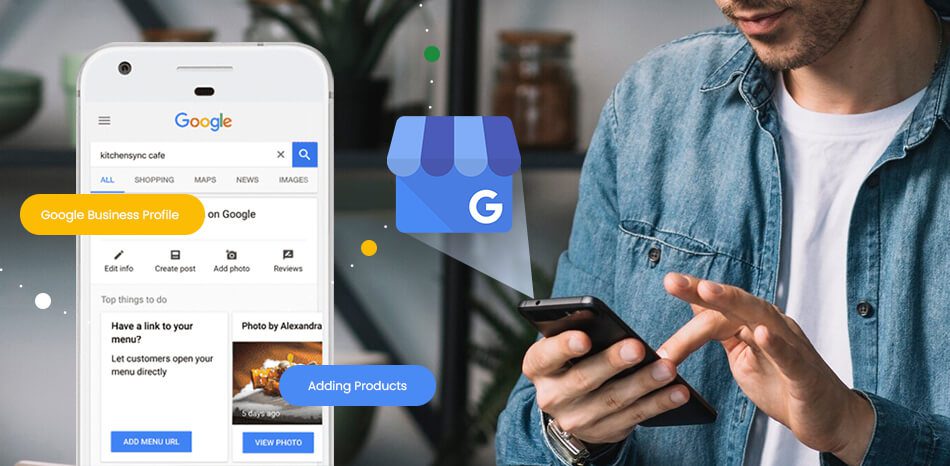
For most restaurants, your Google Business Profile is the first thing a hungry customer sees. Its performance report gives you data most restaurants never check:
- Calls: calls made straight from your listing. For takeaways and busy neighbourhood restaurants, this is often the single most important number.
- Direction requests: people asking Google Maps for the route to your door. This is one of the closest signals you’ll get to real footfall.
- Website clicks and bookings: how many people went from your listing to your site or booking link.
- Search terms: the words people typed before finding you. If most searches are “takeaway near me” rather than “Afghan restaurant Harrow”, that should shape your menu pages, your posts and your ads.
Here’s what that looks like in practice. Between April and June 2026, Farmhouse Pizza in Wembley received 5,276 calls from its Google Business Profile, with a 57% call-through rate across 9,256 total interactions (source: Google Business Profile Insights). For a busy takeaway, calls are the KPI, and that is the number we report on.
If your profile numbers look weak, the answer often isn’t more spend. It’s completing and maintaining the profile you already have: correct categories, an up-to-date menu, fresh photos and replies to every review.
Local Pack Rankings and Map Visibility
The local pack is the map and three restaurant listings that appear at the top of Google for searches like “restaurants near me” or “best curry in Harrow”. It takes a large share of the clicks for those searches. If you’re not in those top three, most hungry people nearby won’t see you.
Track your position for a handful of searches that matter: your cuisine plus your area, “restaurants near me”, and dish searches such as “pizza delivery Wembley”. You can check manually in an incognito window, or use a local rank tracker that shows results from different points around your restaurant.
What moves those rankings: review count and how recent they are, accurate categories, consistent name, address and phone number across directories, distance from the searcher, and how relevant your website is. Each of these can be tracked, and each can be a supporting KPI if Google Maps visibility is your main goal. Our local SEO for restaurants is built around exactly these factors.
Website and SEO
- Organic traffic (Google Analytics): visitors who arrive from Google without you paying for ads. Track it month on month.
- Rankings for money searches (Google Search Console): your position for searches like “brunch Edgware” or “halal restaurant Harrow”. Positions one to three get most of the clicks.
- Menu page views: the menu is usually a restaurant’s most visited page. If people view the menu but never book, the next step isn’t obvious enough.
- Booking and call clicks: set these up as key events in Google Analytics. This is where website traffic becomes something you can count at the door.
If organic traffic is climbing but booking clicks aren’t, you’re either attracting the wrong searches or the website isn’t converting them.
Paid Ads (Google Ads and Meta)
If you run paid campaigns, focus on the KPIs tied to money in and money out:
- Cost per click (CPC): what you pay each time someone clicks. Useful for spotting expensive keywords, but it’s not the goal.
- Cost per booking or call: total ad spend divided by the bookings, calls and orders it produced. This is the number that decides whether an ad stays on.
- Return on ad spend (ROAS): revenue from the ads divided by what you spent on them. Remember that food and drink costs come out of that revenue, so a return that looks healthy on paper can still be thin once your margins are counted.
Most owners watch the cost per click. The number that matters is the cost per booking. A 60p click that never books is more expensive than a £2 click that turns into a table of four. If you’d rather not manage this yourself, see our Google Ads management.
Social Media and Email
Social media and email keep your restaurant in mind between visits, but judge them on what they bring in, not on likes:
- Bookings from a tracked link or offer: give each campaign its own booking link or a simple code (“mention Instagram for a free dessert”) so you can count the results.
- Local reach: the share of your audience that lives close enough to visit. Both Instagram and Facebook show audience locations.
- Email clicks, not opens: open rates are unreliable because Apple Mail Privacy Protection can mark emails as opened when they weren’t. Clicks through to your booking page are a better signal.
- Unsubscribe rate: if it keeps climbing, you’re emailing too often or the offers aren’t relevant.
For a deeper look at turning followers into diners, read how restaurants can actually get customers from Instagram.
How to Measure Restaurant Marketing ROI
Marketing ROI answers the most basic question: for every pound you put in, how many come back?
ROI = (Revenue from marketing − Marketing cost) ÷ Marketing cost × 100
Here’s how that looks for an illustrative independent restaurant. The figures below are an example to show the method, not a client’s results.
Example: a neighbourhood restaurant spends £1,500 a month on marketing: £600 on Google Ads, £600 on local SEO and Google Business Profile management, and £300 on social media.
| Metric | Monthly figure |
| Total marketing spend | £1,500 |
| Tracked bookings, calls and orders | 150 |
| Cost per booking | £10 |
| Bookings that turned into a visit | 120 (80%) |
| Average covers per booking | 2.5 (300 covers) |
| Average spend per cover | £28 |
| Revenue from those visits | £8,400 |
| Marketing ROI (on revenue) | 460% |
For every £1 spent, this restaurant takes £5.60 back at the till. Remember that this is revenue, not profit. Take off food, drink and staff costs before you decide how much more you can spend. Notice also what the calculation needs: knowing how many bookings came in, how many turned up, and what they spent. Without those numbers, you only know that you spent £1,500 and hoped it worked. If you want to run the numbers for SEO specifically, our honest restaurant SEO ROI breakdown has a fill-in-your-own-numbers framework.

If you can’t fill in this table for your restaurant right now, that’s the first thing to fix. Before you change your budget, switch agencies or try a new channel, get the basics recorded.
The tools are simple: Google Analytics for website data, Google Search Console for search performance, your Google Business Profile performance report, the reports in your booking system (such as OpenTable, SevenRooms or ResDiary), and a simple spreadsheet. Add one habit that costs nothing: ask new guests how they found you, and note it down.
How Often Should You Review Restaurant Marketing KPIs?
Monthly is the minimum. Weekly if you’re running paid ads with meaningful daily spend. Quarterly for the bigger picture: lifetime value, overall ROI and which channels bring your best guests.
Weekly. Check ad spend against bookings and calls. Pause anything that is burning budget without producing tables.
Monthly. Review each channel. Update your booking tracker, work out your cost per booking, and compare with last month. One month is a data point. Three months is a trend.
Quarterly. Step back. Which channels brought the most revenue for the money? Where did your regulars first find you? Move budget towards what works and cut what doesn’t.
Don’t confuse reviewing with reacting. Restaurants are seasonal: December parties, summer terraces, school holidays and religious festivals all move the numbers. Compare the same month year on year where you can, and look for trends over three months before making big changes. If you run more than one site, track each location separately. Our guide to tracking local SEO for restaurant chains explains why one combined number hides problems.
If you can’t answer “is my marketing filling tables?” with a specific number, that’s where Spark Digital UK starts. We work only with restaurants, cafés and takeaways, and every monthly report shows bookings, calls, profile views and where your guests came from. Get in touch for a free audit and we’ll show you what to track.
